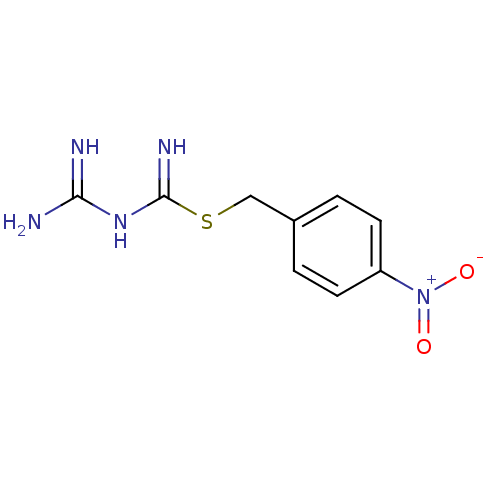
 Found 23 from University of Prince Edward Island
Affinity DataKi: 11.5nM ΔG°: -10.8kcal/molepH: 7.5 T: 2°CAssay Description:The oxidation of NADPH was monitored at 340 nm using a Molecular Devices SpectraMax Plus 96-well microtiter plate reading spectrophotometer. Plots we...More data for this Ligand-Target Pair
 3D Structure (crystal)
Affinity DataIC50: 3nMpH: 7.0 T: 2°CAssay Description:The DHFR inhibition observed with each derivative was characterized by determination and comparison of the IC50 values. IC50 determinations were perf...More data for this Ligand-Target Pair
Affinity DataIC50: 75nMpH: 7.0 T: 2°CAssay Description:The DHFR inhibition observed with each derivative was characterized by determination and comparison of the IC50 values. IC50 determinations were perf...More data for this Ligand-Target Pair
Affinity DataIC50: 75nMpH: 7.0 T: 2°CAssay Description:The DHFR inhibition observed with each derivative was characterized by determination and comparison of the IC50 values. IC50 determinations were perf...More data for this Ligand-Target Pair
TargetProteasome subunit beta type-5(Homo sapiens (Human))
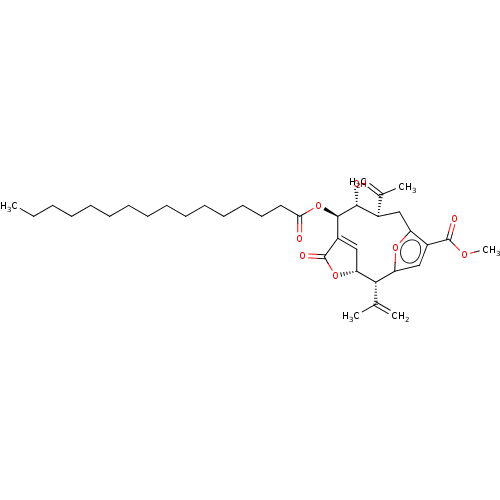
University of Prince Edward Island
Curated by ChEMBL
University of Prince Edward Island
Curated by ChEMBL
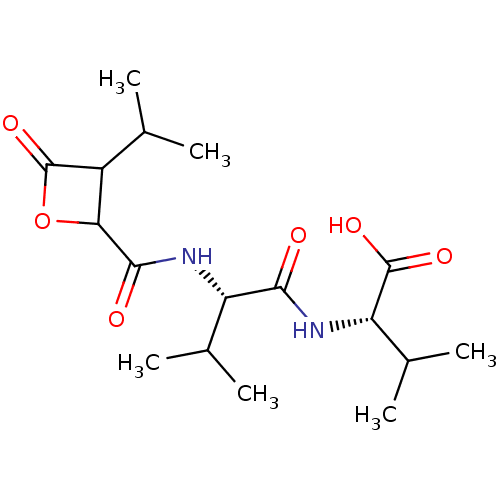
Affinity DataIC50: 360nMAssay Description:Inhibition of chymotrypsin-like activity of human erythrocyte-derived 20S proteasome using Suc-LLVY-AMC as substrate preincubated for 10 mins followe...More data for this Ligand-Target Pair
TargetProteasome subunit beta type-5(Homo sapiens (Human))
University of Prince Edward Island
Curated by ChEMBL
University of Prince Edward Island
Curated by ChEMBL
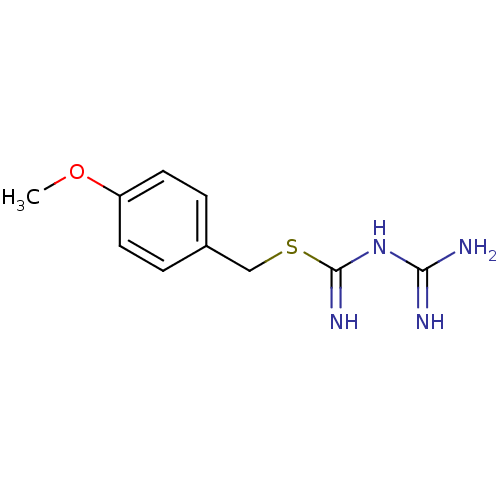
Affinity DataIC50: 930nMAssay Description:Inhibition of chymotrypsin-like activity of human erythrocyte-derived 20S proteasome using Suc-LLVY-AMC as substrate preincubated for 10 mins followe...More data for this Ligand-Target Pair
Affinity DataIC50: 3.30E+3nMpH: 7.0 T: 2°CAssay Description:The DHFR inhibition observed with each derivative was characterized by determination and comparison of the IC50 values. IC50 determinations were perf...More data for this Ligand-Target Pair

Affinity DataIC50: 3.70E+3nMpH: 7.0 T: 2°CAssay Description:The DHFR inhibition observed with each derivative was characterized by determination and comparison of the IC50 values. IC50 determinations were perf...More data for this Ligand-Target Pair
Affinity DataIC50: 3.80E+3nMpH: 7.0 T: 2°CAssay Description:The DHFR inhibition observed with each derivative was characterized by determination and comparison of the IC50 values. IC50 determinations were perf...More data for this Ligand-Target Pair
Affinity DataIC50: 4.30E+3nMpH: 7.0 T: 2°CAssay Description:The DHFR inhibition observed with each derivative was characterized by determination and comparison of the IC50 values. IC50 determinations were perf...More data for this Ligand-Target Pair

Affinity DataIC50: 5.60E+3nMpH: 7.0 T: 2°CAssay Description:The DHFR inhibition observed with each derivative was characterized by determination and comparison of the IC50 values. IC50 determinations were perf...More data for this Ligand-Target Pair

Affinity DataIC50: 1.26E+4nMpH: 7.0 T: 2°CAssay Description:The DHFR inhibition observed with each derivative was characterized by determination and comparison of the IC50 values. IC50 determinations were perf...More data for this Ligand-Target Pair

Affinity DataIC50: 1.30E+4nMpH: 7.0 T: 2°CAssay Description:The DHFR inhibition observed with each derivative was characterized by determination and comparison of the IC50 values. IC50 determinations were perf...More data for this Ligand-Target Pair
Affinity DataIC50: 1.42E+4nMpH: 7.0 T: 2°CAssay Description:The DHFR inhibition observed with each derivative was characterized by determination and comparison of the IC50 values. IC50 determinations were perf...More data for this Ligand-Target Pair
Affinity DataIC50: 1.51E+4nMpH: 7.0 T: 2°CAssay Description:The DHFR inhibition observed with each derivative was characterized by determination and comparison of the IC50 values. IC50 determinations were perf...More data for this Ligand-Target Pair
Affinity DataIC50: 1.89E+4nMpH: 7.0 T: 2°CAssay Description:The DHFR inhibition observed with each derivative was characterized by determination and comparison of the IC50 values. IC50 determinations were perf...More data for this Ligand-Target Pair

Affinity DataIC50: 1.98E+4nMpH: 7.0 T: 2°CAssay Description:The DHFR inhibition observed with each derivative was characterized by determination and comparison of the IC50 values. IC50 determinations were perf...More data for this Ligand-Target Pair

Affinity DataIC50: 2.49E+4nMpH: 7.0 T: 2°CAssay Description:The DHFR inhibition observed with each derivative was characterized by determination and comparison of the IC50 values. IC50 determinations were perf...More data for this Ligand-Target Pair
Affinity DataIC50: 3.46E+4nMpH: 7.0 T: 2°CAssay Description:The DHFR inhibition observed with each derivative was characterized by determination and comparison of the IC50 values. IC50 determinations were perf...More data for this Ligand-Target Pair

Affinity DataIC50: 3.47E+4nMpH: 7.0 T: 2°CAssay Description:The DHFR inhibition observed with each derivative was characterized by determination and comparison of the IC50 values. IC50 determinations were perf...More data for this Ligand-Target Pair
Affinity DataIC50: 3.51E+4nMpH: 7.0 T: 2°CAssay Description:The DHFR inhibition observed with each derivative was characterized by determination and comparison of the IC50 values. IC50 determinations were perf...More data for this Ligand-Target Pair

Affinity DataIC50: 4.06E+4nMpH: 7.0 T: 2°CAssay Description:The DHFR inhibition observed with each derivative was characterized by determination and comparison of the IC50 values. IC50 determinations were perf...More data for this Ligand-Target Pair
TargetTyrosine-protein phosphatase non-receptor type 1(Homo sapiens (Human))
University of Prince Edward Island
Curated by ChEMBL
University of Prince Edward Island
Curated by ChEMBL
Affinity DataIC50: 1.13E+5nMAssay Description:Inhibition of GST-tagged PTP1BMore data for this Ligand-Target Pair